AirMagnet Spectrum ES
The ongoing explosion in mobile data usage, the shift towards 80% of mobile traffic originating in-building, transition from 3G to LTE, and the need for consistent coverage in commercial settings is driving strong growth for in-building wireless networks. The two common technologies that support this are distributed antenna systems (DAS) and small cell networks. Carrier or System Integrator’s RF or Network engineers/technicians, who are responsible for deploying, maintaining and troubleshooting these networks need professional tools that can help them deploy the network right the first time, as well as troubleshoot in a timely and cost-effective manner. One critical tool is an RF spectrum analyzer.
Spectrum Analyzers are used to:
- Measure Antenna Performance
- Obtain RF Baseline
- Measure the isolation between In-Building and Macro networks
- Troubleshoot RF interference issues
- Deploy & Monitor Public Safety DAS networks
Until now, these DAS and small cell deployments have lacked an RF spectrum analyzer that is actually designed around the portability, affordability and in-field testing features necessary for efficient multi-team installation projects at the customer site. As a result they have had to rely on sharing bulky and expensive test equipment that lacks the right functionality, slowing deployments and often leading to costly retest and rework.
-
Product Details and Features

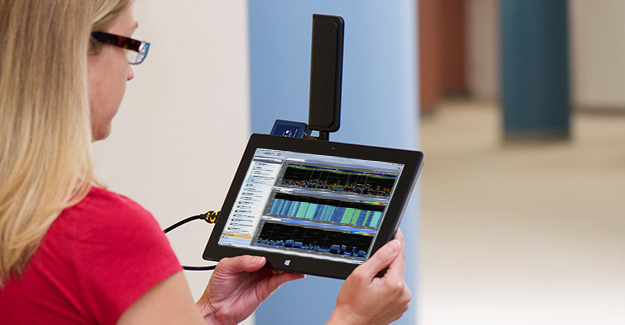
AirMagnet Spectrum ES is a USB-based solution that can be used on any Microsoft® Windows 7 or Windows 8 based Laptop/Tablet PC with a USB port.AirMagnet Spectrum ES™, the industry’s first spectrum analysis tool specifically designed to streamline in-field testing and troubleshooting of cellular offload deployments, including DAS and small cell. AirMagnet Spectrum ES offers the portability, affordability, enhanced in-field productivity features and intuitive network visibility needed to certify and troubleshoot at every stage of the project lifecycle – ensuring offload deployments are done quickly and correctly.
AirMagnet Spectrum ES can scan frequencies between 698 MHz and 2690 MHz and includes support for multiple technologies.Rich Spectrum Graphs
FFT
AirMagnet Spectrum ES’ FFT graphs provide a real-time view into the RF energy in the environment with current, max, max-hold and average RF signal levels.
Next generation visualization enhancements include:- Visualization of Data/Voice events: Visualize the occurrence of GSM, CDMA, W-CDMA and LTE events as they occur in the networks.
- Carrier Blocks display: Visualize the Telco carriers that are operating in that frequency range. This quick overlay overcomes traditional spectrum analyzer challenges of quickly and accurately recognizing the frequencies used by the carriers at a particular location.
- Band Blocks: Visualize band block description for the specific frequency range. This quick overlay overcomes traditional spectrum analyzer limitations of quickly and accurately recognizing the technologies that are in use at a particular location.
Spectrum Density
The Spectrum Density Graph provides a longer-term view into the network by displaying live information on the signals that are common during the current capture session. This is helpful to identify infrequent transmitters.Spectrogram
The Spectrogram graph provides a scrolling history of the RF environment and allows a visual understanding of the spectrum over time to see intermittent spikes or bursts of RF energy that may be causing network problems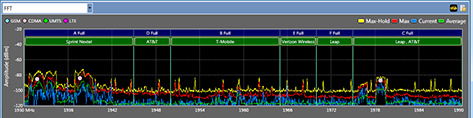
Figure 1: Visualize RF energy across the spectrum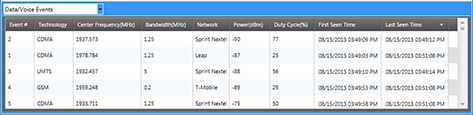
Figure 2: The Data/Voice event window provides a visual presentation of real-time data/voice events that are taking place in a particular frequency range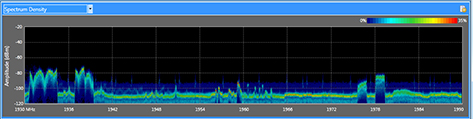
Figure 3: Longer term view into the network using the Spectrum Density Graphs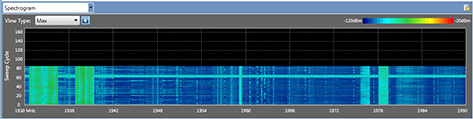
Figure 4: Scrolling history of the RF environment using the Spectrogram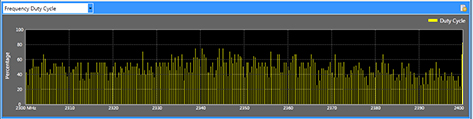
Figure 5: Frequency Duty Cycle shows how long an interfering signal is present in a particular frequency rangeFrequency Duty Cycle
The Duty Cycle graph displays how often an interfering signal is present in a particular frequency range. A high duty cycle could mean an interferer is constantly transmitting and will most certainly cause problems in that frequency range.Capture, Save and Share Spectrum Trace Files
AirMagnet Spectrum ES users can save their RF spectrum scans, retain them as hard evidence and play them back at a later time for post-capture investigation and analysis. This is very helpful as critical forensic information while investigating or troubleshooting. These saved traces can also be shared across the organization for escalations and collaborative troubleshooting.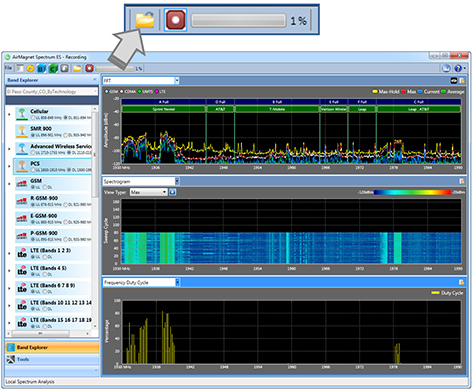
Figure 6: Capture, save and share spectrum trace files for escalations and retaining as forensic evidence.Enhanced Productivity Features
Automated Scan Frequency Sorting and Selection
AirMagnet Spectrum ES provides multiple options for the user to visualize the spectrum, including:- Sort by technology
- Sort by carrier
- Custom range
- Scan all bands
AirMagnet Spectrum ES automates frequency/technology lookup for carriers worldwide. Reducing the need to look up correct frequency ranges for each location helps eliminate error-prone paper-pen methods. AirMagnet Spectrum ES automatically obtains location-based frequency/technology information from the FCC database for US carriers and includes built-in frequency information for 30+ countries worldwide. An all-bands option may be used if a country is not supported in the list or a custom frequency is desired.
Automatic Identification and Location of Interference Sources
A common misconception is that licensed bands (for example, cellular bands) experience very minimal interference that can impact the performance and operation of the network and its operating devices. These interference sources can be intentional or non-intentional and in most situations render the network un-operational. Timely and accurate detection and location of these interference sources is critical to ensuring user satisfaction with network performance. Automating this effort goes a long way toward minimizing the time, effort and money associated with this activity.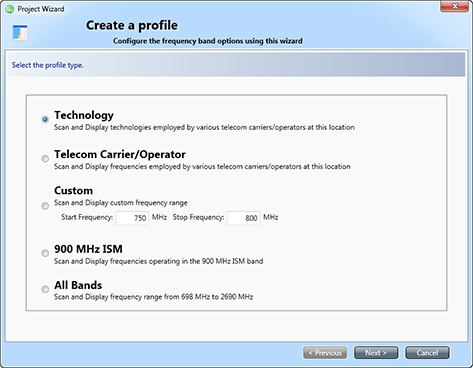
Figure 7: Choose to sort/view information based on your preferences.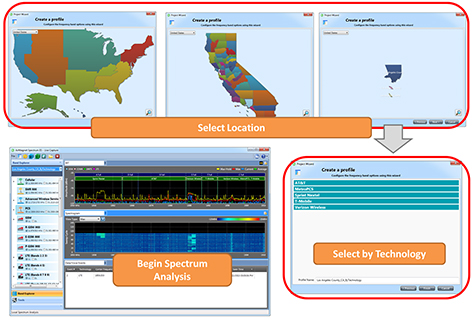
Figure 8: Sort information by technology.AirMagnet Spectrum ES offers the industry’s only real-time detection and identification of interference sources that lower the performance of these licensed networks. Powered by a default classification database that can automatically detect and classify interference sources such as RF jammers and CW transmitters, users are provided detailed information about the interference source, the frequencies it impacts, peak/average power levels and the status of the source.Generally, users must rely upon the spectrum analyzer vendors to create default signatures or classifications for the detection and identification of RF interference sources. Timely response to these requests, while critical to ensuring optimum performance for users, has been a struggle for analyzer vendors. To overcome this hurdle and provide users with a “zero-day” response to any RF interference source, AirMagnet Spectrum ES allows users to create custom signatures for any interference source that can impact the performance of the network.
With AirMagnet Spectrum ES’s built-in “device locator tool”, users can physically locate any interference source operating in the RF environment. The device locator tool operates as a Geiger counter and beeps louder as users get closer to the location of the device.
Antenna Performance Verification using the Power Meter Tool
One of the most important tests conducted for a DAS network, is the verification of the antenna performance, i.e. if the antenna is working as expected or not. There are two methods: 1) performing a one-meter RF test and measuring the power of each antenna from the FFT graph by standing below the antenna or 2) using a power meter tool.Users can physically connect the AirMagnet Spectrum ES adapter directly* to an antenna system and then use the built-in Power Meter Tool to perform the power measurements for the antennas. Users specify the frequency range and channel bandwidth options, and then quickly measure the power readings (current, max or max-hold) for the antennas.
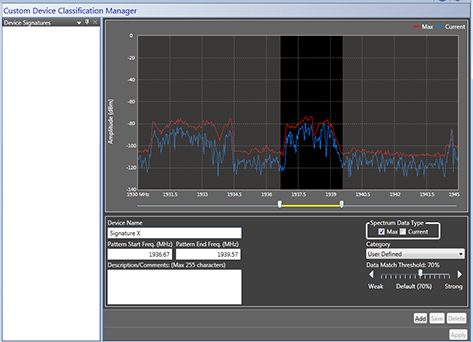
Figure 9: Create custom signatures for any interference source.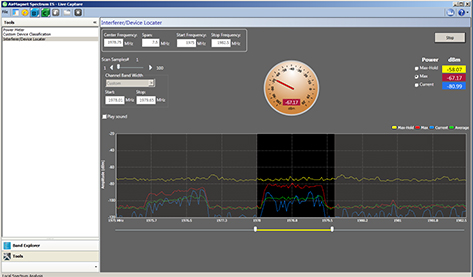
Figure 10: The device locator tool operates as a Geiger counterand beeps louder as users get closer to the interference source.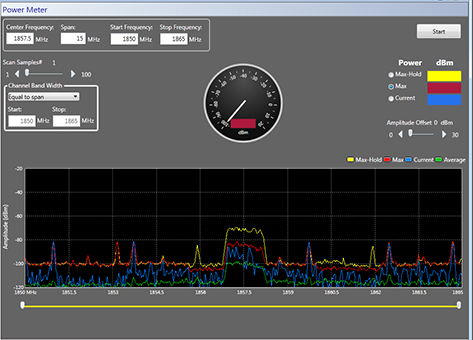
Figure 11: Verify antenna performance using the Power Meter Tool. -

Datasheet: AirMagnet Spectrum ES™
View, Download or Print detailed product specifications.
-
Support for Non-Cellular Technologies
As AirMagnet Spectrum ES can also operate as a general purpose spectrum analyzer, users can use the custom frequency profile option to select any frequency range between 698 MHz to 2690 MHz to scan RF energy for their specialized applications.
This includes support for the 900 MHz band, which includes the ISM and other Federal bands to assist users that deploy or use technologies operating in that spectrum. Some common technologies/applications available in that spectrum include Cordless phones, baby monitors, Power Grid, Z-wave (Home automation), etc.
AirMagnet Spectrum ES as a Security Tool
AirMagnet Spectrum ES can be used in specialized applications and situations where security concerns are critical to the user. If the organization or any federal/military agency implements a “no-fly zone” for cellular access or has the need to detecting cellular devices that may be used for a wrongful purpose, AirMagnet Spectrum ES alerts the user to the presence of a data/voice event originating from a mobile device in the spectrum, and provides rich spectrum graphs that allow users to visualize the power for all of the uplink traffic from a mobile device.
Integration with Wi-Fi Spectrum Analyzer
AirMagnet Spectrum ES integrates with AirMagnet Spectrum XT, the industry leading solution for troubleshooting interference problems for WLAN networks. This integration allows users to verify and troubleshoot “any wireless” problem inside the building.
With a simple click of a button from within the AirMagnet Spectrum ES user interface, users can launch the AirMagnet Spectrum XT application, the industry’s only USB-based professional spectrum analyzer that combines in-depth RF analysis with real-time WLAN information for quicker and more accurate troubleshooting of performance problems.
Ordering Information Part Number Description A6001 AirMagnet Spectrum ES includes software, USB adapter, USB extension cable and external antenna A1680 AirMagnet Spectrum ES bundled with AirMagnet Spectrum XT for analysis of both in-building cellular and 802.11 (Wi-Fi) networks Technical Specifications Specification Description Frequency Range 698 MHz to 2690 MHz Sampling Frequency 20 MHz Real-time acquisition bandwidth 7 MHz (3 dB) Resolution Bandwidth 39.0625 KHz Receive Sensitivity - GSM 200 khZ: -114 dBm
- CDMA 1.25 MHz: -110 dBm
- UMTS 5 MHz: -105 dBm
- LTE 1.4 MHz: -110 dBm
- LTE 3 MHz: -102 dBm
- LTE 5 MHz: -101 dBm
- LTE 10 MHz: -97 dBm
- LTE 15 MHz: -95 dBm
- LTE 20 MHz: -93 dBm
Image Suppression Min: -29 dBc; Max: -40 dBc Max RF input without compression -15 dBm RSSI accuracy +/- 3 dB Display Average Noise Level (DANL) - 698 – 1,2240 MHz: Typical -169 dBm
- 1,240 – 2,690 MHz: Typical -171 dBm
PC Interface USB 2.0 Standards-Compliant Interface Electrical Power: 5V from USB ; current: 382 mA; consumption: 1910 mW Mechanical .3” x 2.3” x 0.6” (134.5mm x 58.1mm x 15.4mm); Weight: 1.5oz Environmental - Operating Temperature Range 0°C to +70°C
- Storage Temperature Range -20°C to +85°C
- Relative Humidity 95% non-condensing
Antenna specifications Frequency range 698 MHz to 960 MHz, 1575.42 MHz, 1710 MHz to 2700 MHz Technologies supported GSM / GPRS/ EDGE / CDMA / EVDO/ UMTS /HSPA+ / LTE Peak Gain Typical 3+ dBi Efficiency Typical 70% Impedance 50 Ω Radiation Pattern Omni Input Power 10 W Casing UV Resistant, PC/ABS Connector SMA Male Antenna specifications Frequency range 698 MHz to 960 MHz, 1575.42 MHz, 1710 MHz to 2700 MHz Technologies supported GSM / GPRS/ EDGE / CDMA / EVDO/ UMTS /HSPA+ / LTE Peak Gain Typical 3+ dBi Efficiency Typical 70% Impedance 50 Ω Radiation Pattern Omni Input Power 10 W Casing UV Resistant, PC/ABS Connector SMA Male Antenna Gain Frequency (MHz) 700 ~ 800 824 ~ 960 1575.42 1710 ~ 1880 1850 ~ 1990 1710 ~ 2170 2400 ~ 2800 Peak Gain (dBi) Free Space Straight 1.1 0.3 1.1 1.9 2.7 2.6 2.7 Free Space Bent 2.6 1.5 2.9 2.7 3.1 3.1 2 30x30cm GP center Straight 2.1 0.7 2.9 1.5 1.9 2 2.9 30x30cm GP center Bent 3.5 1.7 5.2 5.9 6.7 6.4 4.9 30x30cm GP edge Straight 2.6 1.3 1.7 2.1 2.1 2.3 4.3 30x30cm GP edge Bent 2.6 1.8 3.1 2.1 3 2.8 5.1 PCB edge Straight 1.4 1.2 0.9 2.5 3.2 3 1.4 PCB edge Bent 2.1 0.1 2.1 2.4 3.6 3.4 3 Average Gain (dBi) Free Space Straight -1.1 -2.2 -2 -1.5 -1.2 -1.3 -3.5 Free Space Bent -1.1 -2.3 -1.5 -1.5 -1.1 -1.2 -3.1 30x30cm GP center Straight -0.6 -1.6 -2 -1.8 -1.7 -1.7 -3.8 30x30cm GP center Bent -3.5 -4.9 -2.8 -2.4 -1.8 -2 -3 30x30cm GP edge Straight -0.6 -1.5 -1.9 -1.6 -1.4 -1.4 -3.1 30x30cm GP edge Bent -0.6 -1.7 -1.6 -1.5 -1.2 -1.3 -3.1 PCB edge Straight -1 -2 -2 -1.6 -1.4 -1.4 -3.5 PCB edge Bent -0.8 -2.5 -1.6 -1.5 -1.1 -1.3 -3 Minimum PC / Tablet Requirements Operating Systems Microsoft® Windows 7 Enterprise/Professional 32 & 64-bit Microsoft® Windows 8 Pro/Enterprise 32 & 64-bit Processor Intel® Core™ 2 Duo 2.00 GHz or higher RAM 1 GB RAM required (2 GB recommended) Disk Space 150 MB free disk space Software Framework Microsoft .NET Framework 4.0